The Department of Workforce Services has just published an
interactive graphic on older Utahns. Based on 2015 Census Bureau data, it
allows researchers (and the simply curious) to “drill down” to the county
level.
Roughly 15 percent of the state’s population is age 60 and
older. Further, workers age 55 and older make up 17 percent of the labor force.
As the population “greys”, the economic importance of older Utahns will
naturally become of greater importance. The Deseret News recently reported that
in 2015 there were 337 people in Utah over the age of 100. In 50 years, there
will be nearly 7,000.
As an example of the information available and the potential
for insights, this post will focus on Uintah County.
The visualization has six profile segmentations, each
represented by a “tab” above the graphs that one can click on.
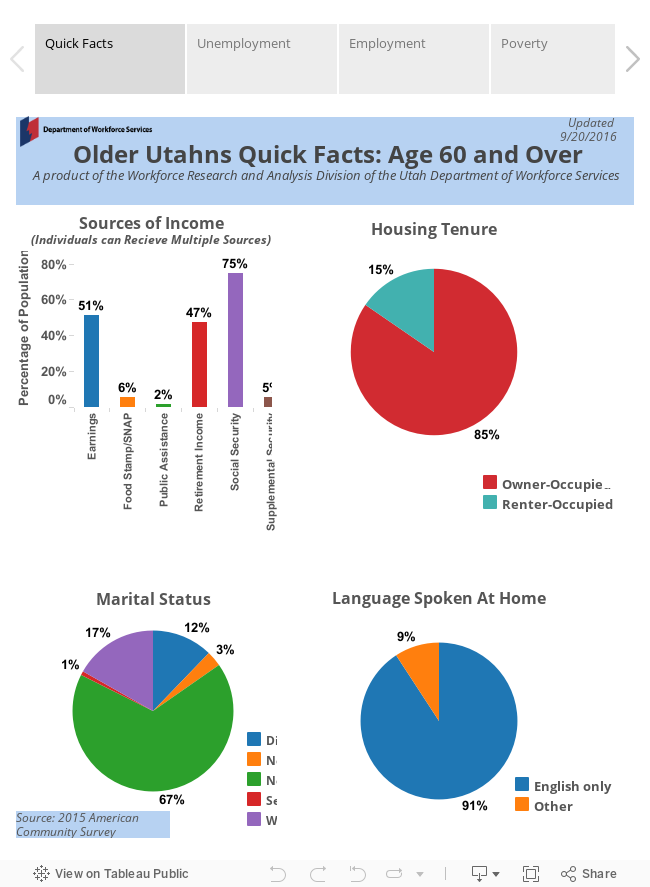
The first tab is a statewide overview of Utahns age 60 and
older. From this the reader can generalize that about half of older Utahns
still receive taxable income (either passive or active) and/or retirement
income. Around 5 percent qualify for some form of public assistance. The
typical older Utahn owns his or her home, is married, and speaks English.
The second tab shows unemployment rates by county and age.
Older (male) Uintah County residents experience lower unemployment than the
state as a whole. Tab three shows that this rate is real rather than ephemeral;
the labor force participation rates up to age 62 are significantly higher than
statewide. After age 62, the comparison reverses; older Uintah County males are
then less likely to participate in the labor force. This pattern seems to be
consistent throughout eastern Utah. Analysts posit that a higher participation
rate for workers under age 62 is out of necessity; private sector jobs that
provide retirement plans are not as common in rural areas. The lower
participation rates after age 62 could be a function of the availability of Social
Security and the more physical nature of occupations in rural areas.
The fourth tab shows the older population sorted by poverty
level, which is $11,670 for an individual. Poverty affects the same proportion of Uintah
County residents as it does Utah residents. However, the proportion of
residents at the highest end of the scale (more than 400 percent of poverty or
$46,680) is smaller in the county than statewide.
The fifth tab displays insurance coverage differentiated by
educational attainment for older Utahns. Note that there is no display for
persons without coverage; due to Medicare, that number is statistically zero
for both Uintah County and the state as a whole for persons over age 65.
It is somewhat surprising that so many Uintah County
residents over age 65 are covered by private insurance. Given lower than
statewide labor force participation, this is somewhat puzzling. Private
insurance coverage also correlates with education. Better educated workers have
better noncash benefits and would therefore prefer their private plan over the
public options.
The sixth and final tab shows disability rates for older
Utahns. Disability rates for Uintah County residents are generally the same as
for older Utahns statewide. However, the rates for residents age 75 and over
are lower for the county. For men, the difference is almost 10 percent. This
difference could be a function of access to medical care; disabled residents
might be moving to urban centers because of the availability of more
specialized healthcare providers.