Across the United States, jobs are quantified through each state’s unemployment insurance program. Those programs provide the potential for laid-off workers to receive unemployment benefits — the goal being to bridge the gap between workers’ lost jobs and their next jobs. An eligible recipient’s weekly benefit amount is based upon their earnings from recent work. This begs the question, how does Utah’s unemployment insurance program know how much an individual recently earned while working?
That answer is supplied by all businesses that hire workers, as they must report their employees and pay as mandated by the unemployment insurance laws. Companies identify their individual workers and those workers’ monetary earnings for a calendar quarter. As businesses are identified by their industrial activity and geographic location, it is through the unemployment insurance program that aggregate employment counts by industry and location are calculated.
Yet each state’s profiling of individuals is quite minimal in the unemployment insurance program. The U.S. Census Bureau can bring more light to the overall labor force by supplementing said information with gender, age, race/ethnicity and educational attainment (imputted from American Community Survey responses) for Utah’s labor force.
The Census Bureau packages this information through their Local Employment Dynamics program and makes available said data on its website. Here at the Department of Workforce Services, we recently downloaded and packaged Utah-specific data from said website and summarized it in the attached visualization.
Various data “tabs” are available, presenting Utah’s economy from different angles, ranging from industry shares within the economy to the age-group distributions of the labor force, to gender and race distributions. These labor variables can be viewed for the state as a whole, or by each individual county.
Some statewide highlights:
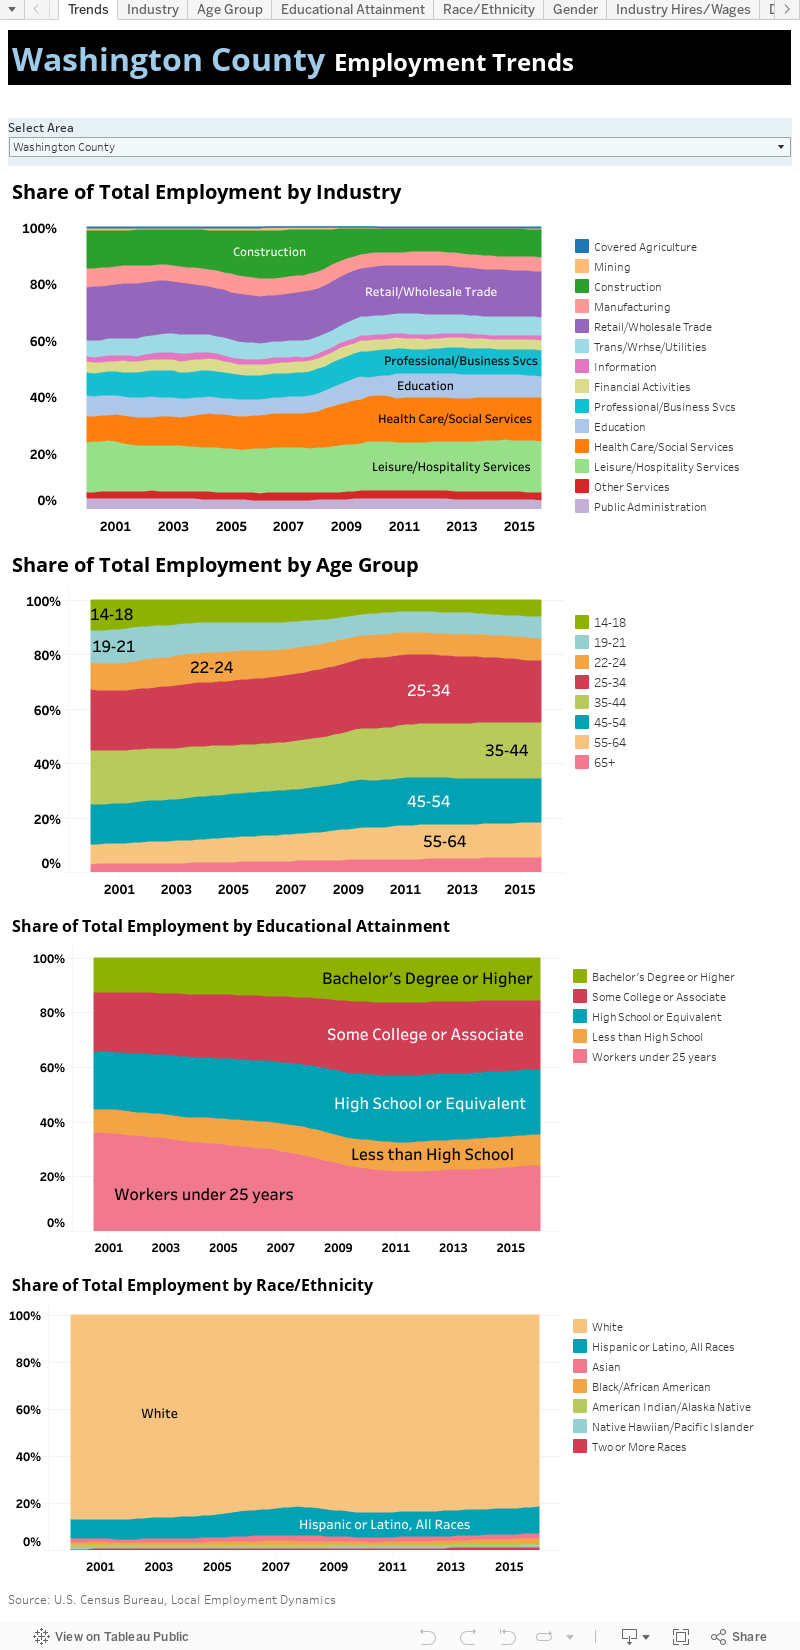
Industry — industrial distribution is quite diverse, which provides strength within the economy. Distributions do fluctuate with time, with manufacturing seeing its share lessen while health care and professional and business services shares have increased.
Age — the bulk of Utah’s labor force is composed of 25- to 44-year-olds. Older worker shares have increased over the past 15 years, yet still remain a non-dominant portion of Utah’s labor force. The youngest segments of the labor force declined noticeably during the Great Recession due to less participation, and that trend remains.
Educational Attainment — turnover rates are understandably highest with workers under the age of 25 as they strive to build their educational foundation and also find their niche in the labor market. A trend does stand out where the more education that a worker attains, the lower the turnover rate businesses experience from said educational classes.
Race/Ethnicity — Whites account for around 80 percent of Utah’s labor force. The Asian community is small but slowly increasing in share, and is also characterized with the lowest turnover rate and the highest new-hire wages.
Gender — males comprise about 55 percent of Utah’s labor force. The female share of 45 percent is higher than the national average. Roughly 35 percent of working females work part-time compared to 15 percent for males. Therefore, female new-hire wages are considerably lower than male new-hire wages. (Note: employer reporting into the unemployment insurance system is not hourly wage rate reporting but instead total calendar quarter wages paid. Therefore, calculations can only be made upon total quarterly wages, and part-time employment weakens this measure).
As for the various counties in the region, here are some labor highlights:
Uintah Mining employs about the same share that it did in 2000. In 2000 and 2016, the mining sector accounted for 16 percent of all jobs. The age of the workforce has increased markedly. In 2000, 32 percent of the workforce was 25 or younger. The current share is 19 percent. Paradoxically, the share of workers with a high school diploma or less has actually increased. In 2000, this group comprised 33 percent of employment. The 2016 number is 39 percent.
Duchesne The mining sector has become the dominant force in the economy. Its share increased from 9 percent in 2000 to 21 percent in 2015. Trade and Education have shrunk as a share of total jobs. Their combined share decreased from 37 percent in 2000 to 25 percent in 2015. Like Uintah County, the age of the workforce has increased markedly. In 2000, 31 percent of the workforce was 25 or younger. The current share is 16 percent. The share of workers with a high school diploma or less has also increased. In 2000, this group comprised 34 percent of employment. The 2016 number is 41 percent.
Daggett The Daggett County economy has become more diverse. In 2000, Public Administration and Leisure and Hospitality, and Education made up 79 percent of all jobs. In 2015, this number had decreased to 70 percent. Daggett County has also seen the age of the workforce has increased. In 2000, 45 percent of the workforce was 25 or younger. The current share is 15 percent. Workers 65 years and older increased their share from 4 percent in 2000 to 10 percent in 2015. Consistent with the trend, the share of workers with a high school diploma or less has actually increased. In 2000, this group comprised 45 percent of employment. The 2016 number is 21 percent. The workforce, while still overwhelmingly white, has become more diverse. The minority share of jobs grew from 6 percent in 2000 to 11 percent by 2015.